Model Rocket Altimeter Part 1: Electronics

Introduction

I do model rocketry with my son, Leon. He has enjoyed the fire, noise and setup since he was 3. I think it’s a good activity to introduce him to STEM over time. Since starting, I have always wanted to know how far up our rockets went. There are commercial altimeters, which are very practical and rocket-proven. However, where’s the fun when it’s all already made ?

Therefore, I decided to see how quick of a hardware setup could be done to get an altimeter fitted in one of my model rocket’s payload bay.

My current payload-able rocket is a Quest Payloader ONE. It was an easy build and is big enough to fit a Lego minifig, which Leon really enjoys.

Quest Payloader ONE Rocket

A while back, I had started design on a full socket inertial computer with 9DOF IMU and pressure sensor for altitude, all processed by an ARM Cortex M3 MCU. It turns out I don’t have enough spare time at home to get back to this large of a project 🙂 Maybe when Leon is older… In the meantime, I thought I’d start with off-the-shelf components.

The requirements for the rocket altimeter are as follows:

  • Low-cost
  • Barometer-based: use absolute pressure to .
  • Highest resolution and accuracy possible at low cost
  • Powered by a rechargeable battery
  • Uses only COTS modules

Design

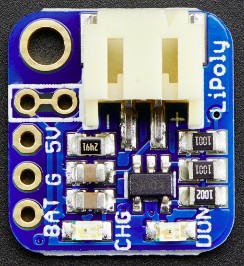
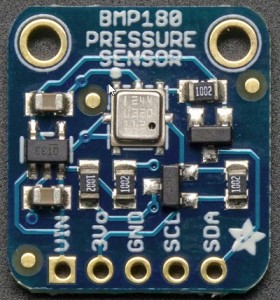
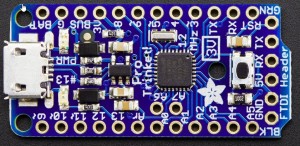
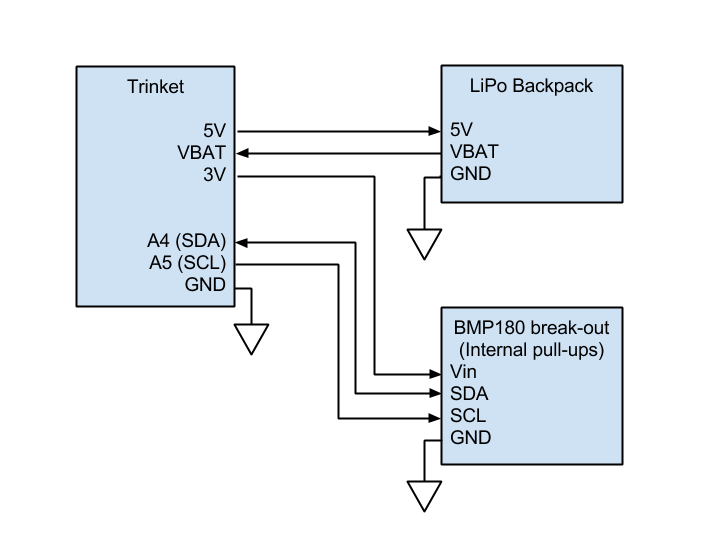
The design is based on three Adafruit modules:

The whole thing is powered by a SparkFun 3.7V LiPo battery.

The design is trivial:

  • Battery and LiPo backpack power the Trinket
  • BMP180 is connected by I2C to Trinket
  • Reset button clears the run
  • Trinket computes altitude
  • LED on Trinket will give-out coded altitude

To read-out the altitude, I plan to make a phone app that uses the camera and image processing to decode an encoded data representation formed by LED blinks. This way, I do not have to take the altimeter outside the body to read-out with wires, or add a bluetooth or other radio that is heavy and power-hungry. On the upside, doing image processing is fun 🙂

The basic block diagram is as follows:

Rocket altimeter block diagram

Adafruit LiPo backpack for Trinket Pro
Adafruit BMP180 break-out board
Adafruit TrinketPro 3V

Assembly

Once I got the parts, assembling them took about 30 minutes. A few headers, some 30AWG wire and we’re done.

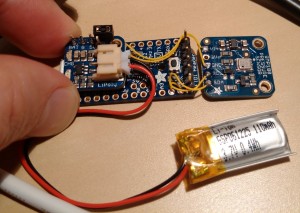
Here is what it looks like before being fitted in the rocket:


Overview of rocket altimeter circuit
Overview of assembled rocket altimeter circuit

The switch area of the LiPo backpack is fitted with a mini 0.1″ jumper, to be used as a power switch. Connecting the Trinket Pro 3V by USB recharges the battery. The LED on digital pin 13 is visible if looking sideways at the board.

It’s that easy! Now, I just need to program the firmware, mobile device app and build the frame to hold it in the rocket 🙂 A few weeks of work ahead at 3 hours per week!

The mechanical design of the frame to hold it in the rocket and the software will be described in my next posts.

Stream tee in Python: saving STDOUT to file while keeping the console alive

Today, I was debugging within the Simics virtual platform debugger when I needed to log my console to file, while still being able to work with it.

Usually, I would have done:

c:\prompt> [commands to start Simics] > out.txt

However, this kills the console since stdout is fully redirected to a file.

I quickly coded a short hack that allows me to redirect Simics’ built-in Python interpreter’s standard-out stream to a file, without it becoming invisible. The trick is to make a delegate stream that keeps a copy of sys.stdout and emits every calls to the stream to both a log stream and sys.stdout. This trick works to redirect stdout in any Python interpreter or program, not just Simics. The hack to catch all method calls (ie: open(), close(), write()) on the stream_tee instance is derived from a post on GitHub from Anand Kunal.

The class that does this in Python is as follows:

class stream_tee(object):
    # Based on https://gist.github.com/327585 by Anand Kunal
    def __init__(self, stream1, stream2):
        self.stream1 = stream1
        self.stream2 = stream2
        self.__missing_method_name = None # Hack!
 
    def __getattribute__(self, name):
        return object.__getattribute__(self, name)
 
    def __getattr__(self, name):
        self.__missing_method_name = name # Could also be a property
        return getattr(self, '__methodmissing__')
 
    def __methodmissing__(self, *args, **kwargs):
            # Emit method call to the log copy
            callable2 = getattr(self.stream2, self.__missing_method_name)
            callable2(*args, **kwargs)
 
            # Emit method call to stdout (stream 1)
            callable1 = getattr(self.stream1, self.__missing_method_name)
            return callable1(*args, **kwargs)

To use it to redirect standard out, simply do:

import sys
from stream_tee import *
 
logfile = file("blah.txt", "w+")
sys.stdout = stream_tee(sys.stdout, logfile)
# Now, every operation on sys.stdout is also mirrored on logfile

In a Simics script, this can be done like so:

@import sys
@from stream_tee import *
@logfile = file("blah.txt", "w+")
@sys.stdout = stream_tee(sys.stdout, logfile)

This short hack allows me to save my entire sessions, while being able to work interactively in the shell. For some reason, Simics 4.0 does not have such an auto-logging feature…

As a side effect, the method just shown can be used and extended to replicate method calls on multiple instances of a class (not just streams), by wrapping them in a generalized “tee”. The only caveat is that only one of the instances can actually be used to return the value from the method call. This seems to work good on streams though 😉

Easy BGA PCB footprints generation with AutoBGA

I have just recently finished work on version 1.2 of an open-source tool called AutoBGA.

AutoBGA is a program that takes images of ball grid arrays (BGAs) from datasheets to automatically construct a PCB footprint of the package. The generation of such footprints is usually a tedious and error-prone process because of the large number of pads which must be precisely placed and named.

For many BGA footprints with a mostly full grid, the traditional method is to use some automated scripts to obtain a large grid with every ball drawn, from which missing balls are manually deleted. However, for complex patterns of many modern chips, it becomes a nightmare to do manually. The following footprint for the Texas Instruments AM3517 Sitara ARM processor is an example of a large BGA with a hard to reproduce pattern:

AM3517 BGA pattern
AM3517 BGA pattern

My friend Olivier Allaire had this exact chip for which he had to generate the footprint, along with several other BGAs in use in his SPCube interface card for the SONIA project. It took him quite a while to do it by hand, so it gave me the the idea to automate the process using image processing.

After a few evenings of hacking, I had developed version 1.0 of AutoBGA. It is written in Python and uses the Python Imaging Library as well as wxPython for the GUI.

To extract the BGA pattern from an image, there are many possible ways to go. The straightforward naive algorithm involves scaling the image down to the size of the BGA and thresholding it. Since a lot of datasheets contain measurement lines and annotations overlaid on top of the ball pattern (see the picture above), this algorithm is easily fooled.

My algorithm is based on several heuristics and it works as follows:

  1. Threshold the image assuming mostly black over white.
  2. Separate the image into NX by NY bins of pixels, where NX and NY are the numbers of balls horizontally and vertically.
  3. For each bin, apply cleaning:
    1. Any horizontal line containing more than 70% of pixels is cleared
    2. Any vertical line containing more than 70% of pixels is cleared
    3. Any bin whose approximate convex hull is less than 20% of the width or height is cleared
    4. At this point, most measurement lines and artifacts have disappeared
  4. Use either Gonzalez & Wood’s iterative thresholding algorithm, or Otsu’s method tresholding to determine which bins are “full” (contain a ball) or “empty”. The threshold is calculated as if we had an NX by NY pixels image, with the number of black pixels lit in each bin being the “intensity value”.
  5. Generate a named grid according to BGA ball nomenclature rules
  6. Cast the names onto the balls detected

The choice of algorithm in step 4 is based on some more heuristics developed through testing.

After much testing, this algorithm has proven very robust. While the current version of AutoBGA (1.2) has a feature to edit the detected ball grid to correct mistakes, this has not proven to be necessary in all my tests with very weird/bad images.

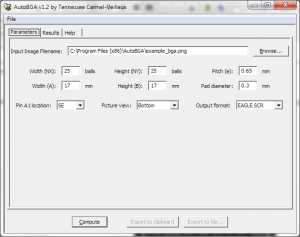
AutoBGA Main Screen
AutoBGA Main Screen

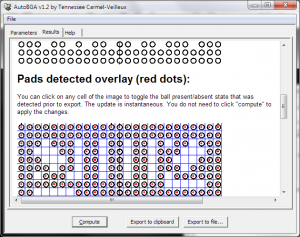
AutoBGA Result Report

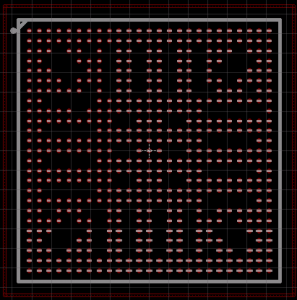
AutoBGA also can draw the footprint outline for the silkscreen, as well as the courtyard, based on IPC7351 rules. The following image shows the result when drawn in EAGLE.

Sample output in EAGLE from AutoBGA

The following formats are supported for CAD output:

  • EAGLE script (full-featured)
  • XML (full-featured and generic enough to be used as a source for any other CAD program through a converter)
  • TSV (just the positions and names of the balls)

I have released the source code of AutoBGA on a Google Code page under a BSD license. If anyone wants to add support for more CAD output formats, you’re more than welcome to do so. Right now, the tool is production-ready and works under both Windows and Linux. I assume it works under MacOS, but it is untested. As long as the library dependencies are met, it should work.

Video: TX-0, TX-2 and LINC- Early MIT Computers

Here is another video from some VHS tapes I digitized from the  “Bay Area Computer History Perspectives” series of lectures. These lectures were sponsored by Sun Microsystems Inc in the mid-90’s and were part of the first activities of the Computer History Museum. I was lucky enough to get some of these tapes directly from Jeanie Treichel, when I was an intern at Sun Labs back in 2008. Jeanie was an important figure in organizing these lectures, along with Peter Nurkse.

Click on the screenshot to reach the video hosted on PicasaWeb:

From Computer History Videos

This second lecture I make available is entitled “TX-0, TX-2 and LINC” (10/26/1998). The lecturers discuss the history and architecture of the early MIT programmable computers: TX0, TX-2 (the never-built TX-1 is mentioned) and the LINC, which was one of the first real-time lab computers with display and keyboard. Wes Clark, who was the principal architect for all 3 machines, leads the lecture.

The lecturers are:

Here is a short lost of topics discussed in this 2-hour long video:

  • Wesley A Clark giving a good history of TX0 and then TX-2.
    • The advent of the Core memory and its effect.
    • Going from tubes to transistors.
    • Demo of Sketchpad (Ivan Sutherland’s groundbreaking drawing program).
    • The TX-2 architecture
  • Lots of trivia about work in the trenches of early research computers.
  • Good stories about the Xerographic printer they had (based on a photocopier, that required fire extinguishers if bugs in the code made the paper go in too slow).
  • The horn of the computer to prevent people from frying when the power got turned on.
  • Misc trivia about the TX-2
  • Pictorial descriptions of the LINC
    • Multiple versions of the LINC
    • Screen shots showing assembly listing on the oscilloscope
    • Screen shots of graphics

This video is really enlightening for anyone in the younger generations of computer engineers and computer scientists. I strongly recommend it, especially since it shows the early stages of video display development on computers.

    Pre-processed assembler and C integer literals

    The Problem

    It is very convenient to use a C preprocessor before running an assembler, so that constants can be shared between C code and assembly code. GCC makes this very easy, by pre-processing assembler sources if specified on the command line or if the extension is “.S” (“.s” is not preprocessed).

    A problem arises if the constants defined in the header file use valid C syntax to specify that an integer literal is unsigned, long, etc. In embedded programming, it is very common to add the “UL” suffix to address literals or while building bit masks. This prevents problems related to undesired signed comparison or undefined behavior of shifts left (<<) of signed values. The suffix syntax used (ie: “0xdeadbeefUL” or “1234U” or “1234L“) is incompatible with most assemblers, including the GNU assembler. After preprocessing, these constants will appear with suffix in the assembler source, thus yielding weird error messages.

    Example of problematic constants:

    #define PTEHI_V                 (0x80000000UL)
    #define PTEHI_VSID_MASK         (0x7FFFFF80UL)

    In the assembly code (PowerPC in this case):

    addis   r4,0,(PTEHI_VSID_MASK >> 16)
    ori     r4,r4,(PTEHI_VSID_MASK & 0xffff)

    After preprocessing, the source becomes:

    addis   r4,0,((0x7FFFFF80UL) >> 16)
    ori     r4,r4,((0x7FFFFF80UL) & 0xffff)

    The error message (quite valid) from the assembler:

    test.s:1: Error: missing ')'
    test.s:1: Error: missing ')'
    test.s:1: Error: operand out of range (0x7fffff80 is not between 0xffff0000 and 0x0000ffff)
    test.s:1: Error: syntax error; found `U' but expected `,'
    test.s:1: Error: junk at end of line: `UL)>>16)'
    test.s:2: Error: missing ')'
    test.s:2: Error: missing ')'
    test.s:2: Error: operand out of range (0x7fffff80 is not between 0x00000000 and 0x0000ffff)
    test.s:2: Error: syntax error; found `U' but expected `,'
    test.s:2: Error: junk at end of line: `UL)&0xffff)'

    The Solution

    It might seem like this is trivial to fix:

    #if !defined(__ASSEMBLER__)
    #define PTEHI_V                 (0x80000000UL)
    #define PTEHI_VSID_MASK         (0x7FFFFF80UL)
    #else
    #define PTEHI_V                 (0x80000000)
    #define PTEHI_VSID_MASK         (0x7FFFFF80)
    #endif /* !defined(__ASSEMBLER__) */

    I’ve seen this solution a few times. However, that involves needless duplication of values and is error-prone.

    Another option is to “forget” about the suffixes because you “know” that ints have the same size as longs on your platform, or some other similar argument. Believe it or not, this is very common :-|. You may not actually be sure

    My middle-ground solution is to define macros that deal with adding the suffixes only in C. It is actually a very common method (not at all my invention), and used often in the Linux kernel for instance. Here are the macros:

    #if defined(__ASSEMBLER__)
     
    #if !defined(_UL)
    #define _U(x) x
    #define _L(x) x
    #define _UL(x) x
    #endif /* !defined(UL) */
     
    #else
     
    #if !defined(_UL)
    #define _U(x) x ## U
    #define _L(x) x ## L
    #define _UL(x) x ## UL
    #endif /* !defined(UL) */
     
    #endif /* defined(__ASSEMBLER__) */

    This way, you can write the following in your header:

    #define PTEHI_V                 (_UL(0x80000000))
    #define PTEHI_VSID_MASK         (_UL(0x7FFFFF80))

    and the preprocessor deals with the rest.

    The macro definitions for _U(), _L() and _UL() can be put in some global configuration constants header included on the compiler’s command-line (like Linux’s previous config.h).

    5 minute interrupt controller bug chase and fix with Simics

    The problem

    I was writing and testing the interrupt processing code for a real-time hypervisor on the MPC8641 Multi-core PowerPC SoC.

    During testing, I hit a bug: the system would not take any more interrupts after the highest priority interrupt got serviced.

    Since I was debugging on the Wind River Simics virtual platform, debugging the problem was pretty straightforward. I’ve had this exact kind of bug on a hardware platform before (ARM9-based) and it had taken me hours to debug.

    With Simics, I have full system-level introspection, forward/reverse execution, full memory-space access and an infinite number of breakpoints. Since the platform is virtual, problems like interrupt debugging are unaffected by the passage of time, which also helps, although it wasn’t a problem in this case.

    In the solution part of this post, I show how I found the bug and tested a fix. The video is a re-enactment (I wasn’t recording while I was working), but it shows the exact steps I took, in less than 5 minutes.

    About the problem context

    Classic PowerPCs have a 32-entry exception table. Out of these, one (offset 0x0500) single entry is for all external interrupts.

    The MPC8641 has an OpenPIC-compliant peripheral interrupt controller (PIC) that makes it easy to handle a vast amount of interrupts from that single exception table entry. Each interrupt source has a vector identifier, a destination control and a priority field. Automatic nesting control  is provided by the PIC.

    Basically, the control flow of an exception with that setup is

    • CPU core is interrupted by PIC because a source is ready
    • Interrupt processing vectors to 0x00000500 or 0xfff00500, depending on MSR[IP].
    • We handle the interrupt:
      • Save enough context to make the system recoverable and permit
      • Read the IACK register of the PIC to acknowledge the interrupt and get its vector
      • Re-enable interrupts by setting MSR[EE]
      • Finish saving context
      • → Jump to interrupt-specfic handler
      • â†� Return from handler
      • Write 0 to the PIC’s EOI register to signal the end of processing of the highest-priority interrupt
      • Restore context
      • Return from interrupt

    That’s a lot of steps, and a lot can go wrong :).

    gate.ioThe solution

    Thanks to Simics, I got a pretty good idea, simply because of event logging:

    [pic spec-viol] Write to read-only register IACK0 (value written = 0x0).

    Wow, thanks 🙂 ! That’s a good starting point. No way a development board would have told me that…

    The video shows how I narrowed it down to a write to IACK instead of a read from EOI before context restoration. I used reverse execution and on-line code patching to get the job done.

    After the bug was found, I identified the problem in the actual source code:

    The EOI setting macro was:

    #define EOI_CODE(z,r)                                                  \
        li      z,0;                                                        \
        lis     r,(CCSR_BASE+BOARD_PIC_BASE+BOARD_PIC_IACK_OFFSET)@h;       \
        ori     r,r,(CCSR_BASE+BOARD_PIC_BASE+BOARD_PIC_IACK_OFFSET)@l;     \
        stw     z,0(r)

    when it should have been:

    #define EOI_CODE(z,r)                                                  \
        li      z,0;                                                        \
        lis     r,(CCSR_BASE+BOARD_PIC_BASE+BOARD_PIC_EOI_OFFSET)@h;       \
        ori     r,r,(CCSR_BASE+BOARD_PIC_BASE+BOARD_PIC_EOI_OFFSET)@l;     \
        stw     z,0(r)

    It was simply the case of a cut-and-paste error from the IACK-setting macro, but one that would have been pretty nasty to find using just a JTAG debugger.

    A worksheet for bitwise operations

    Click here to download the worksheet (PDF)

    The problem

    When doing a lot of low-level system code, you constantly need to build hexadecimal constants and masks for bitwise arithmetic. Maybe you are accessing specific bits of an I/O register, or making sure you extract the proper field of a packed variable.

    You can scribble your binary and hexadecimal masks on a loose sheet of paper, but this is error-prone. Most calculators are unwieldy when it comes to bitwise manipulations and spreadsheets are heavyweight.

    The solution

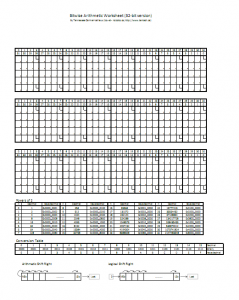
    Here is a worksheet you can print to ease the work of applying bitwise operations (rotates, shifts, masks) or building binary and hexadecimal constants.

    Its features are:

    • Compatible with Letter or A4 paper
    • Three grids of 5 lines for 32-bit work
      • Separated by nibbles (4-bit groups) for easy conversion from binary to hex
      • First and last line of each grid has a hex digit box in each nibble
      • Regular (bit 0 is LSb) and PowerPC (bit 0 is MSb) bit indices in each column
      • Decimal weight in small in each box (1,2,4,8)
    • Table of the 32 first powers of 2
    • Decimal/Binary/Hexadecimal conversion table reminder for values 0-15

    This worksheet makes quick work of generating mask constants or figuring-out a pesky rlwimi (Rotate Left Word Immediate Mask Insert) operands list.

    Click here to download the worksheet (PDF)

    Here are some screenshots:

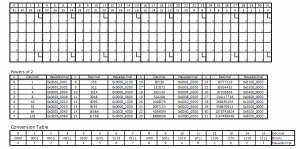
    Detail of grid and tables
    Detail of grid and tables
    Full worksheet overview
    Full worksheet overview
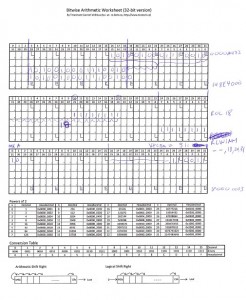
    Example of worksheet in use (scanned)
    Example of worksheet in use (scanned)

    Easy multi-core PowerPC timebase synchronization with Simics

    The problem

    When writing low-level multi-core OS code, it is important that all cores have at least some form of time synchronization so that scheduling can be done using local timers. On 32-bit PowerPCs, this is usually accomplished by making sure the 64-bit Time Base register (made up of TBL and TBU, the lower and upper parts, respectively) is about the same value (within a few microseconds) on each core.

    Under Linux, a fancy, cryptic, undocumented racing algorithm provides this feature at boot time. The code for that is here.

    There are other ways to synchronize the timebase, all of which offer a complexity-versus-accuracy compromise.

    If you are developping your code using help from the Wind River Simics virtual platform, you can use the advantages of functional simulation to get the job done perfectly (cycle-true equal timebases on each core) before your synchronization code is perfected.

    The solution

    Synchronizing the timebase to a common value on all processor cores can be achieved with some Simics scripting magic.

    Basically, we will setup a magic instruction breakpoint (a fancy nop that traps to a simulator handler) to force the timebase to be reset on every core.

    Step 1: Insert the target code in your embedded software

    This is the easy part.

    Simply replace all of your timebase synchronization code with a single magic instruction. In my case, this is done by a function called by every processor at boot time. Only CPU 0 (the “master” of the booting process) will run the magic instruction.

    I chose magic instruction number 4 for illustration purposes. The MAGIC() macro is available in the “src/include/simics/magic-instructions.h” header file from the Simics installation.

    static void __VBOOT synchronize_clocks(void)
    {
        if (0 == GET_CPU_ID())
        {
            /* Magic instruction number 4 will be
             * handled by Simics to synchronize the timebases */
            MAGIC(4);
        }
        /* Join at a synchronizing barrier */
        BarrierWait(&g_smpPartitionInitBarrier);
    }
     
    /* .... Later in the core */
     
    synchronize_clocks();

    Step 2: Create a timebase synchronization handler in Python

    The Simics simulator uses the Python language as an internal scripting engine. We can easily write “hap” handlers that execute custom code in the simulator when an event occurs. Simulator events are called “haps” in Simics.

    The following Python code should be put in a new file (in my case “setup-core-test-haps.py”:

    def synchronize_ppc_timebase():
        # Get number of CPUs from system 0. This assumes only one
        # system is running. There are other ways to get the number
        # of cores.
        num_cpus = conf.sim.cpu_info[0][1]
     
        # Iterate through all the cores
        for cpu_id in range(num_cpus):
            cpu = getattr(conf, "cpu%d" % cpu_id)
     
            # Simply reset the timebase
            cpu.tbu = 0
            cpu.tbl = 0
     
        print "Synchronized the CPU timebases at cpu0 cycle count %ld" % SIM_cycle_count(conf.cpu0)
     
    # Magic callback handler table. Each dictionnary key should
    # be the magic instruction number and the value should be the
    # handler function to call.
    magic_callbacks = { 4: synchronize_ppc_timebase }
     
    def magic_hap_callback(user_arg, cpu, magic_inst_num):
        # Call the registered callback if it exists
        if magic_callbacks.has_key(magic_inst_num):
            magic_callbacks[magic_inst_num]()
        else:
            SIM_break_simulation("No handler for magic breakpoint id=%d" % magic_inst_num)
     
    # Add the hap callback for magic instructions
    SIM_hap_add_callback("Core_Magic_Instruction", magic_hap_callback, None)

    The code above defines the synchronization function that resets the timebase on all cores “at once” (this takes 0 time and is executed between instructions).

    Whenever MAGIC(4) is encountered, the handler will be called and the timebases will be reset.

    The sample code also shows how to register a simple hap handler for magic instructions. I used a generic magic_callbacks table so that this file can grow with additional special behavior defined as magic instructions.

    Step 3: Enable magic instructions and setup the hap callback

    To use the magic instruction I just defined, I need to run the code within the Simics simulator and enable magic instructions. Simics uses an internal scripting engine separate from Python for simpler command-line and initialization interactions.

    The setup is done by adding the following two lines of Simics script in my main simulation setup script (a “.simics” extension file):

    # Use magic breakpoints
    enable-magic-breakpoint
     
    run-python-file filename = setup-core-test-haps.py

    Results

    After the set-up, the timebases get synchronized when the “synchronize_clocks()” C function call is made in the kernel. If we stop the simulation further down the road, we can inspect the state of the timebases to validate they are indeed equal:

    simics> run
    Synchronized the CPU timebases at cpu0 cycle count 46748008
    running> stop
    simics> cpu0->tbl
    61573459
    simics> cpu1->tbl
    61573459
    simics> cpu2->tbl
    61573459
    simics>

    Note that there could be discrepancies between the values if the simulator was running with longer-than-one time quanta between cores.

    Since Simics is a functional simulators, it has several speed optimizations, including running cores interleaved. This means that more time can have passed in one core, compared to another. When running with “cycle-by-cycle” execution (“cpu-switch-time 1” command in Simics), the CPUs are always within one cycle of each other.

    Middle mouse button scroll locking in Eclipse

    Direct link with no explanation for those in a hurry (I did not make this software)

    I have been suffering from repetitive strain injuries (RSI) since 2003. It started with my student job  as a data-entry clerk for a bank from 1999 to 2004. Since then, I have been coping with bouts of wrist tendonitis exacerbated by typing, mousing and handling my infant son 🙂

    I do most of my coding under Eclipse and I already have a somewhat ergonomic setup with a Kinesis Freestyle keyboard and a Contour Mouse Optical from Contour Design.

    Kinesis Freestyle keyboard
    Kinesis Freestyle keyboard
    Contour Mouse Optical
    Contour Mouse Optical

    I have been replacing repeated scroll-wheel motion with auto-scrolling (“scroll locking”) in web browsers. I was trying to find an equivalent for Eclipse. I found a small project on Google Code that does just that:

    The eclipse-mmb-scroller plug-in by Mateusz Matela adds middle mouse button scrolling to Eclipse 3.2+. I have tried it under Eclipse 3.6 Helios and it works great. Just copy the contents of the distribution’s “plugins” folder to your Eclipse installation’s “plugins” folder and restart. I recommend it to reduce RSI problems related to repetitive scrolling with the wheel.

    Here it is in action: